A recent report published by analyst firm Butler Analytics, compares two of the leading players in data visualisation (visual analytics) and exploration space. Although Qlik and Tableau both provide platforms that support easy-to-use visualisation and discovery tools, the report demonstrates how their approach varies enormously.
Butler Analytics: Tableau and Qlik Sense comparison
The report states that whilst the two are often compared, they are really quite different beasts.
“What really distinguishes Qlik Sense is its extensibility and the associative data engine, which gives new meaning to the word ‘discovery’. Qlik Sense comes with a scripting language and multiple APIs for creating new visualization types, embedding visualizations into production applications, creating custom data connectors – and so on.”
The report also highlights Qlik Sense positioning for the growing pressure to govern self-service BI environments, so that security, data permissions, authentication and similar issues are addressed adequately.
Butler Analytics: Company differences
Butler analytics report that the actual companies are also quite different.
“Tableau has successfully brought data visualization to the status of a commodity item. The sales and marketing posture certainly encourages this view – everyone can be a data visualization Ninja. It’s a nice sentiment, but skills are needed for any task, and interpreting data visualizations do need at least some level of business knowledge, and an understanding of the way a visualization works – with its potential pitfalls.”
In comparison, they make the following observations about Qlik:
“Qlik is obviously competing in this market, but the posture is less that associated with a consumer product. The considerable sophistication of the Qlik Sense architecture and technology waits in the background for when users want to start pushing the envelope – and so it’s not so much of a commodity sell.”
Butler Analytics: Tableau v. Qlik
The report then proceeds to give a summary of each solution and notes that the choice between Tableau and Qlik Sense can only be made once the organisation knows what it wants.
“If needs are fairly straightforward, and not likely to grow in sophistication, then Tableau is a good alternative. Although it has to be said that Qlik Sense addresses this space admirably too. However, most seasoned users of business intelligence technologies will know that future needs can never really be anticipated, and so it’s best to have an open architecture, and in this respect, Qlik Sense truly excels. Tableau can be extended somewhat, but it’s going to be harder work. Both platforms deliver excellent scalability and easy data visualization. Beyond this, they are really quite different in nature.”
Butler Analytics: Qlik Sense summary
Butler Analytics: Tableau Summary
“Tableau ease-of-use is almost legendary – primarily because they majored on this in such a focused manner. The platform is also very scalable and supports some very large implementations. But as previously mentioned Tableau is hobbled to some extent by its poor extensibility – an issue that should not be underestimated insignificance. Provided users are happy with Tableau as supplied ‘out of the box’, it will deliver a very productive environment.”
Butler Analytics: Ratings
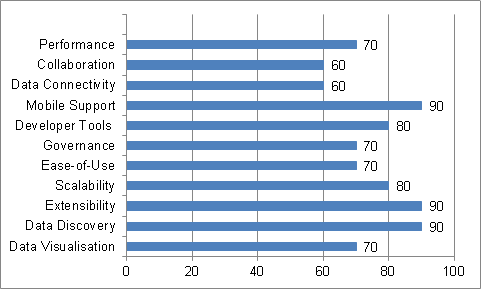
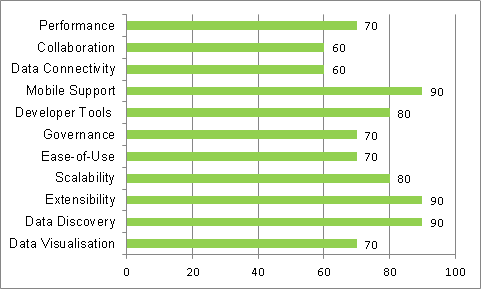
In the report Tableau and Qlik Sense are compared using rating score. The results are shown below:
Tableau Rating Score:
Rating average for Tableau: 59.6%
Qlik Rating Score:
Rating average for Qlik Sense 75.5%
Note about scoring:
It is important to understand that these ratings score Tableau and Qlik Sense for what they do, and not what they might do. So for example, Tableau is given a low rating for advanced analytics because simply providing some level of integration with R is not particularly state-of-the-art. Qlik Sense, on the other hand, makes no attempt at predictive analytics or other advanced analytics, and so it does not appear on the ratings. The other thing to consider is that 50% is average. Anything above that is above average – and clearly desirable.
The ratings decide the tier a product is placed in. 0 – 25% tier 4, 25 – 50% tier 3, 50 – 75% tier 2 and 75 – 100% tier 1.
Conclusion
After providing a fair comparison of both companies and their business intelligence offerings, Butler Analytics draws on the following conclusion.
About Butler Analytics
Butler Analytics is a boutique IT analyst firm specializing in business analytics technologies and methods. It was founded by Martin Butler, best known as the founder of Butler Group which, prior to its acquisition, was Europe’s largest indigenous IT analyst firm.
Read more about the power of Qlik Sense or download a copy of the Butler Analytics Report.
